# Software
# NTP
stands for Network Time Protocol 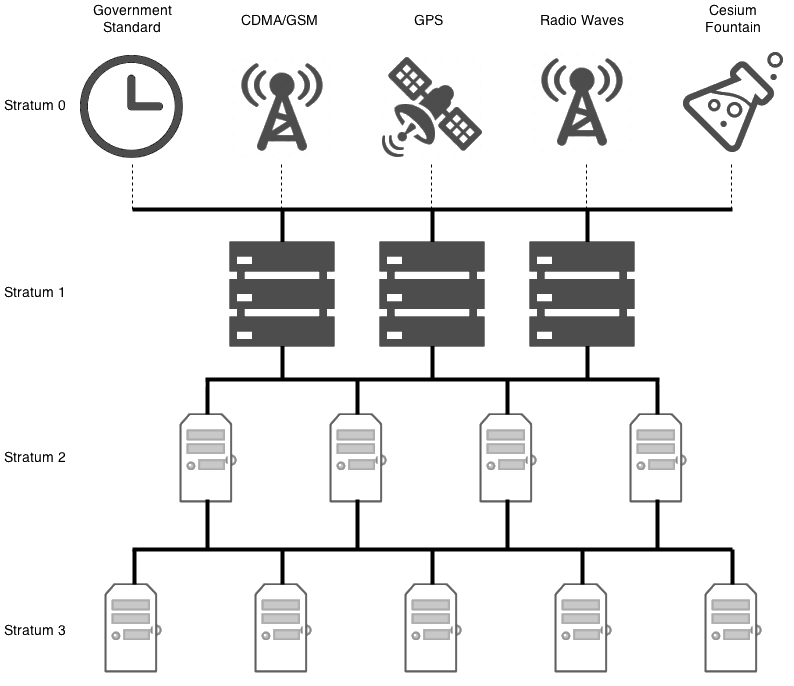
# (client = server)
Debian, Ubuntu, Fedora, CentOS, and most operating system vendors, don't package NTP into client and server packages separately.
When you install NTP, you've made your computer both a server, and a client simultaneously.
# Pool Project
As a client, rather than pointing your servers to static IP addresses, you may want to consider using the NTP pool project. Various people all over the world have donated their stratum 1 and stratum 2 servers to the pool, Microsoft, XMission, and even myself have offered their servers to the project. As such, clients can point their NTP configuration to the pool, which will round robin and load balance which server you will be connecting to.
There are a number of different domains that you can use for the round robin. For example, if you live in the United States, you could use:
- 0.us.pool.ntp.org
- 1.us.pool.ntp.org
- 2.us.pool.ntp.org
- 3.us.pool.ntp.org
There are round robin domains for each continent, minus Antarctica, and for many countries in each of those continents. There are also round robin servers for projects, such as Ubuntu and Debian:
- 0.debian.pool.ntp.org
- 1.debian.pool.ntp.org
- 2.debian.pool.ntp.org
- 3.debian.pool.ntp.org
On my public NTP stratum 2 server, I run the following command to see its status:
ntpq -pn
    remote            refid      st t when poll reach   delay   offset  jitter

------------------------------------------------------------------------------
*198.60.22.240   .GPS.            1 u  912 1024  377    0.488   -0.016   0.098
+199.104.120.73  .GPS.            1 u   88 1024  377    0.966    0.014   1.379
-155.98.64.225   .GPS.            1 u   74 1024  377    2.782    0.296   0.158
-137.190.2.4     .GPS.            1 u 1020 1024  377    5.248    0.194   0.371
-131.188.3.221   .DCFp.           1 u  952 1024  377  147.806   -3.160   0.198
-217.34.142.19   .LFa.            1 u  885 1024  377  161.499   -8.044   5.839
-184.22.153.11   .WWVB.           1 u  167 1024  377   65.175   -8.151   0.131
+216.218.192.202 .CDMA.           1 u   66 1024  377   39.293    0.003   0.121
-64.147.116.229  .ACTS.           1 u   62 1024  377   16.606    4.206   0.216
2
3
4
5
6
7
8
9
10
11
12
13
# Requisites
apt-get install ntp
ntpq -p
vim /etc/ntp.conf
sudo service ntp restart
ntpq -p


ntpstat

unsynchronised
time server re-starting
polling server every 64 s


ntpstat

synchronised to NTP server (10.10.10.10) at stratum 4
       time correct to within 323 ms
       polling server every 64 s


ntpq -c peers

remote refid st t when poll reach delay offset jitter
======================================================================
hamilton-nat.nu .INIT. 16 u - 64 0 0.000 0.000 0.001
ns2.telecom.lt .INIT. 16 u - 64 0 0.000 0.000 0.001
fidji.daupheus. .INIT. 16 u - 64 0 0.000 0.000 0.001
2
3
4
5
6
7
8
9
10
11
12
13
14
15
16
17
18
19
20
21
22
23
24
25
26
27
28
29
# How to test ntp server
# Ntpdate
standalone client
You have to be root to be able to run ntpdate
apt install ntpdate
sudo su -
2
You should see adjust time server
ntpdate 10.10.10.10
19 Aug 16:50:18 ntpdate[23334]: adjust time server 10.10.10.10 offset 0.002230 sec
2
Wrong server config
ntpdate 10.10.10.10
19 Aug 15:00:07 ntpdate[67130]: no server suitable for synchronization found
2
# nmap
- working
nmap -sU --script ntp-info -p 123 ntp.ovh.net -Pn

Starting Nmap 7.40 ( https://nmap.org ) at 2020-08-20 14:55 CEST
Nmap scan report for ntp.ovh.net (213.251.128.249)
Host is up (0.0072s latency).
rDNS record for 213.251.128.249: ntp0.ovh.net
PORT    STATE SERVICE
123/udp open  ntp
| ntp-info:
|_  receive time stamp: 2020-08-20T12:55:25

Nmap done: 1 IP address (1 host up) scanned in 10.56 seconds
2
3
4
5
6
7
8
9
10
11
12
- not working
nmap -sU --script ntp-info -p 123 ntp.ovh.net -Pn

Starting Nmap 7.70 ( https://nmap.org ) at 2020-08-20 12:55 UTC
Nmap scan report for ntp.ovh.net (213.251.128.249)
Host is up.
rDNS record for 213.251.128.249: ntp0.ovh.net

PORT    STATE         SERVICE
123/udp open|filtered ntp

Nmap done: 1 IP address (1 host up) scanned in 22.47 seconds
2
3
4
5
6
7
8
9
10
11
# Monitoring
/etc/zabbix/zabbix_agentd.d/userparameter_ntp.conf
# Drift
The drift file is used to store the frequency offset between the system clock running at its nominal frequency and the frequency required to remain in synchronization with UTC.
If present, the value contained in the drift file is read at system start and used to correct the clock source. Use of the drift file reduces the time required to achieve a stable and accurate time.
The value is calculated, and the drift file replaced, once per hour by ntpd. The drift file is replaced, rather than just updated, and for this reason the drift file must be in a directory for which ntpd has write permissions.
A unit can be : sec/day
"each day your system would be unsynchronized from X seconds"
But the unit of the drift file is in PPM (part per million (of a day))
For example if you have a drift of 18.116 (ppm) :
drift = drift_file_value * day in sec
drift = 18.116 ppm * sec in an hour * hour count
drift = 18.116/1000000 * 3600 * 24
drift = 1.565 sec/day
2
3
4
Each day your system would be unsynchronized of 1,565 sec. But fortunately isn't due to system which adapt the local clock after reading this ntp.drift 😃
UserParameter=time.drift[*],cat /var/lib/ntp/ntp.drift
# Offset
Offset generally refers to the difference in time between an external timing reference and time on a local machine.
The greater the offset, the more inaccurate the timing source is. Synchronised NTP servers will generally have a low offset. Offset is generally measured in milliseconds.
UserParameter=time.offset[*],ntpdate -p 1 -q pool.ntp.org | grep -oP '(?<=offset ).*?(?= sec)'

UserParameter=time.offset_metas_ch[*],ntpdate -p 1 -q ntp.metas.ch | grep -oP '(?<=offset ).*?(?= sec)'
2
3
# Config tricks
server ntp.metas.ch iburst
server ntp.obspm.fr iburst
server ntp2.jussieu.fr iburst
server ntp.uvsq.fr iburst
server ntp.u-psud.fr iburst
server ntp1.belbone.be iburst


server 127.127.1.0
fudge  127.127.1.0 stratum 10
2
3
4
5
6
7
8
9
10
As you can see you have an additional lines
server 127.127.1.0
Which define localhost as fallback ntp server in case you lose your internet connectivity.
The fudge 127.127.1.0 stratum 10 is here to tell your server localhost is a level 10 server (in a scale of 0 to 16 as seen above on article). This way, in most situations, localhost won't be selected. Because other servers should be stratum 1, 2, 3 or in worst case 4
# Find best NTP for me
https://www.pool.ntp.org/en/
A friend of mine have tested 100+ ntp servers and here is the list of the best :
- ntp.metas.ch
- ntp.obspm.fr
- ntp2.jussieu.fr
- ntp.uvsq.fr
- ntp.u-psud.fr
- ntp1.belbone.be
# Concepts / Doc
We need to understand each of the columns, so we understand what this is saying:
| Column | Meaning |
|---|---|
| remote | The remote server you wish to synchronize your clock with |
| refid | The upstream stratum to the remote server. For stratum 1 servers, this will be the stratum 0 source. |
| st | The stratum level, 0 through 16. |
| t | The type of connection. Can be "u" for unicast or manycast, "b" for broadcast or multicast, "l" for local reference clock, "s" for symmetric peer, "A" for a manycast server, "B" for a broadcast server, or "M" for a multicast server |
| when | The last time when the server was queried for the time. Default is seconds, or "m" will be displayed for minutes, "h" for hours and "d" for days. |
| poll | How often the server is queried for the time, with a minimum of 16 seconds to a maximum of 36 hours. It's also displayed as a value from a power of two. Typically, it's between 64 seconds and 1024 seconds. |
| reach | This is an 8-bit left shift octal value that shows the success and failure rate of communicating with the remote server. Success means the bit is set, failure means the bit is not set. 377 is the highest value. |
| delay | This value is displayed in milliseconds, and shows the round trip time (RTT) of your computer communicating with the remote server. |
| offset | This value is displayed in milliseconds, using root mean squares, and shows how far off your clock is from the reported time the server gave you. It can be positive or negative. |
| jitter | This number is an absolute value in milliseconds, showing the root mean squared deviation of your offsets. |
Next to the remote server, you'll notice a single character. This character is referred to as the "tally code", and indicates whether or not NTP is or will be using that remote server in order to synchronize your clock. Here are the possible values:
| remote single character | Meaning |
|---|---|
| whitespace | Discarded as not valid. Could be that you cannot communicate with the remote machine (it's not online), this time source is a ".LOCL." refid time source, it's a high stratum server, or the remote server is using this computer as an NTP server. |
| x | Discarded by the intersection algorithm. |
| . | Discarded by table overflow (not used). |
| - | Discarded by the cluster algorithm. |
| + | Included in the combine algorithm. This is a good candidate if the current server we are synchronizing with is discarded for any reason. |
| # | Good remote server to be used as an alternative backup. This is only shown if you have more than 10 remote servers. |
| * | The current system peer. The computer is using this remote server as its time source to synchronize the clock |
| o | Pulse per second (PPS) peer. This is generally used with GPS time sources, although any time source delivering a PPS will do. This tally code and the previous tally code "*" will not be displayed simultaneously. |
# Tmux
Depuis le shell, avant de rentrer dans une session tmux
tmux ls
tmux new
tmux new -s session
tmux attach
tmux attach -t session_name
tmux kill-server : kill all sessions
:setw synchronize-panes on
:setw synchronize-panes off
:set-window-option xterm-keys on
2
3
4
5
6
7
8
9
# [.tmux.conf]
set-window-option -g xterm-keys on
# Inside tmux
Ctrl + B : (to press each time before another command)
| Command | meaning |
|---|---|
| Flèches | = se déplacer dans le splitage des fenêtres |
| N | "Next window" |
| P | "Previous window" |
| z | : zoom in/out in the current span |
| d | : detach from the current and let it running on the background (to be reattached to later) |
| x | : kill |
| % | vertical split |
| " | horizontal split |
| o | : swap panes |
| q | : show pane numbers |
| x | : kill pane |
| + | : break pane into window (e.g. to select text by mouse to copy) |
| - | : restore pane from window |
| ⍽ | : space - toggle between layouts |
| q | (Show pane numbers, when the numbers show up type the key to goto that pane) |
| { | (Move the current pane left) |
| } | (Move the current pane right) |
| z | toggle pane zoom |
| ":set synchronise-panes on" : | synchronise_all_panes in the current session (to execute parallel tasks like multiple iperfs client)" |
# Wireshark
# DNS Analysis with Tshark
It just plugs into
tshark -f "udp port 53" -Y "dns.qry.type == A and dns.flags.response == 0"
count total dns query
tshark -f "udp port 53" -n -T fields -e dns.qry.name | wc -l
# HTTP
# HTTP Analysis with Tshark
tshark -i wlan0 -Y http.request -T fields -e http.host -e http.user_agent
# Parse User Agents and Frequency with Standard Shell Commands
tshark -r example.pcap -Y http.request -T fields -e http.host -e http.user_agent | sort | uniq -c | sort -n
# Using additional HTTP filters in Analysis
tshark -r example.pcap -Y http.request -T fields -e http.host -e ip.dst -e http.request.full_uri
# Using additional HTTP filters in Analysis
tshark -r example.pcap -Y http.request -T fields -e http.host -e ip.dst -e http.request.full_uri
# Elastic Search
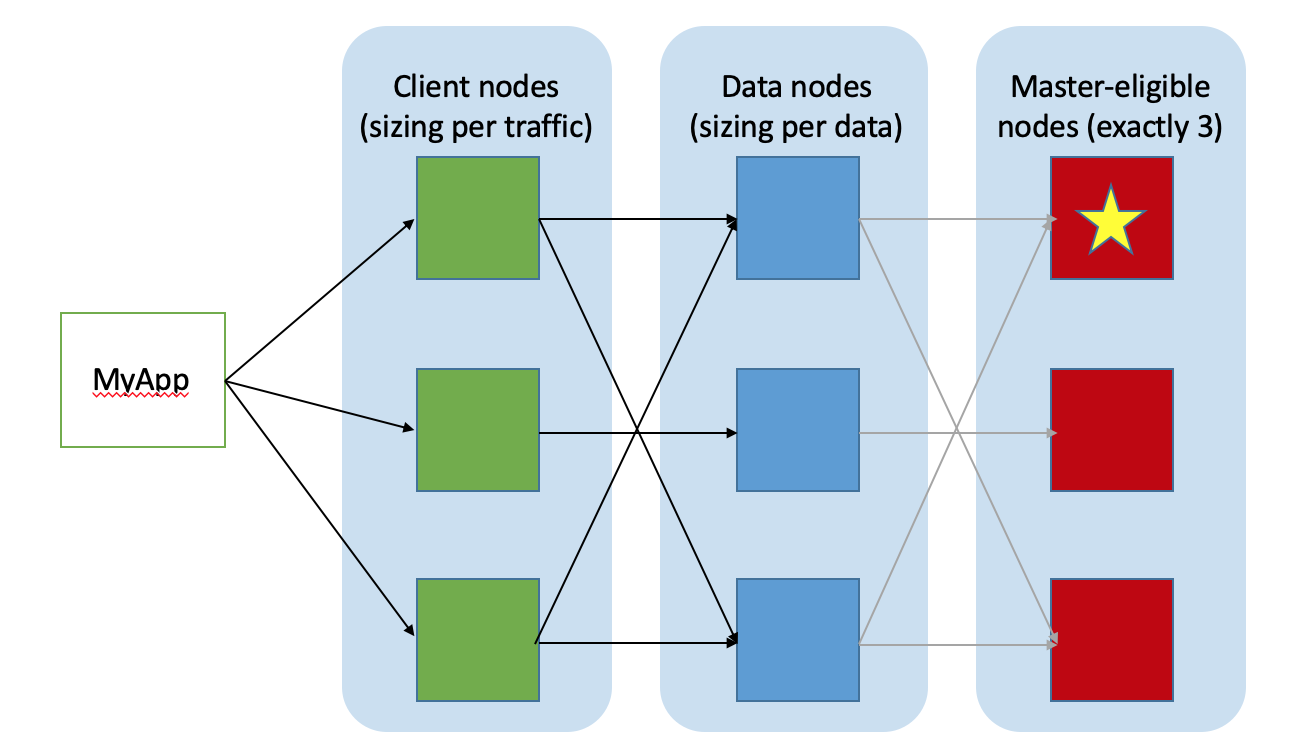
By default, each index in Elasticsearch is allocated 5 primary shards and 1 replica which means that if you have at least two nodes in your cluster, your index will have 5 primary shards and another 5 replica shards (1 complete replica) for a total of 10 shards per index.
# Get Infos
http://ip:9200
Nodes name, load, heap, Disk used, segments, JDK version
/_cat/nodes?v
/_cat/nodes?v&h=name,ip,load_1m,heapPercent,disk.used_percent,segments.count,jdk
2
info plus précises sur les index
/_cat/indices/__INDEX__/?v&h=index,health,pri,rep,docs.count,store.size,search.query_current,segments,memory.total
compter le nombre de doc
/_cat/count/__INDEX__/?v&h=dc
savoir l'état du cluster à un instant T
/_cat/health
full stats index
/__INDEX__/_stats?pretty=true
Kopg plugin
/_plugin/kopf
# Dump / Backup
Very good tutorial https://blog.ruanbekker.com/blog/2017/11/22/using-elasticdump-to-backup-elasticsearch-indexes-to-json/
Warning DO NOT BACKUP with wildcard matching
I tested to backup indexes with wildcard, It works but when you want to put back the data, elasticdump takes ALL the DATA from ALL index from the the json file to feed the one you provide in the url. Exemple :
elasticdump --input=es_test-index-wildcard.json --output=http://localhost:9200/test-index-1 --type=data
In this exemple the file es_test-index-wildcard.json was the result of the following command, which matches 2 indexes (test-index-1 and test-index-2)
elasticdump --input=http://localhost:9200/test-index-* --output=es_test-index-1.json --type=data
So, I'll have to manually expand all various indexes in order to back them up !
Elasticsearch Cluster Topology
# Templates
Change the future index sharding and and replicas and other stuff.
For example, if you have a mono-node cluster, you don't want any replica nor sharding.
curl -X POST '127.0.0.1:9200/_template/default' \
 -H 'Content-Type: application/json' \
 -d '
 {
  "index_patterns": ["*"],
  "order": -1,
  "settings": {
    "number_of_shards": "1",
    "number_of_replicas": "0"
  }
}
 ' \
 | jq .
2
3
4
5
6
7
8
9
10
11
12
13
# Troubleshooting
When a data node restart / reboot. Old, not present anymore, indices can respawn from the past. Which make the cluster come red state.
In this case you can manually delete them by pattern matching.
curl -X DELETE 'http://10.10.10.10:9200/.monitoring-*2020.10.*'
# Php-FPM
check config
php-fpm7.2 -t
# HAProxy
# Check config
haproxy -f /etc/haproxy/haproxy.cfg -c -V
# logging
Meaning of various status codesopen in new window
# TLS
- Tls
coockie:statefull(locally stored) - Tls
ticket:stateless(has to be the same PFS among all haproxy)
# Java
# JDK
version
java -version
openjdk version "1.8.0_222"
OpenJDK Runtime Environment (build 1.8.0_222-b10)
OpenJDK 64-Bit Server VM (build 25.222-b10, mixed mode)
2
3
4
# Memory management
Heap, stack etcopen in new window
# Java - certificate authority
Java doesn't use system CA but a specific keystore You can manage the keystore with keytool
keytool -list -v -keystore /usr/jdk64/jdk1.7.0_62/jre/lib/security/cacerts

keytool -import -alias dolphin_ltd_root_ca -file /etc/pki/ca-trust/source/anchors/dolphin_ltd_root_ca.crt -keystore /usr/jdk64/jdk1.7.0_62/jre/lib/security/cacerts
keytool -import -alias dolphin_ltd_subordinate_ca -file /etc/pki/ca-trust/source/anchors/dolphin_ltd_subordinate_ca.crt -keystore /usr/jdk64/jdk1.7.0_62/jre/lib/security/cacerts

keytool -delete -alias dolphin_ltd_root_ca -keystore /usr/jdk64/jdk1.7.0_62/jre/lib/security/cacerts
keytool -delete -alias dolphin_ltd_subordinate_ca -keystore /usr/jdk64/jdk1.7.0_62/jre/lib/security/cacerts
2
3
4
5
6
7
# RabbitMQ
rabbitmqctl add_user my_user 'my_password'
rabbitmqctl set_permissions "my_user" ".*" ".*" ".*"
rabbitmqctl list_permissions
2
3
Listing permissions for vhost "/" ...
user	configure	write	read
my_user	.*	.*	.*
2
3
Further doc :
# Node js
# NPM (Node Package Manager)
npm est le gestionnaire de paquets officiel de Node.js. Depuis la version 0.6.3 de Node.js, npm fait partie de l'environnement et est donc automatiquement installé par défaut. npm fonctionne avec un terminal et gère les dépendances pour une application.
npm config set proxy http://ip:port
npm config set https-proxy http://ip:port

hashtag Print the effective node_modules FOLDER to standard out.
npm root
npm root -g

hashtag display a tree of every package found in the user’s folders (without the -g option it only shows the current directory’s packages)
npm list -g --depth 0

hashtag To show the package registry entry for the connect package, you can do this:
npm view ghost-cli
npm info ghost-cli
2
3
4
5
6
7
8
9
10
11
12
13
# NPM Script
# NVM (Node Version Manager)
nvm install 8.9.4
# Yarn
# Usage
will read yarn.lock (like PipFile.lock)
yarn setup
verify dep tree is ok
yarn --check-files
grep grunt.registerTask Gruntfile.js
[knex-migrator]
2
3
# Varnish
# Common
# Varnishadm
varnishadm -S /etc/varnish/secret
# For states of backend
varnishadm -S /etc/varnish/secret debug.health
# new version
varnishadm -S /etc/varnish/secret backend.list
# After a crash of varnish:
varnishadm -S /etc/varnish/secret panic.show
2
3
4
5
6
7
# VarnishLog
Log hash with filter for request number
varnishlog -c -i Hash
# varnishncsa
Not enabled by default exemple de commandes pour tracker les requêtes ayant pris plus de 10 seconde
varnishncsa -F '%t "%r" %s %{Varnish:time_firstbyte}x %{VCL_Log:backend}x' -q "Timestamp:Process[2] > 10.0"
# Purging
# HTTP purging
CURL -X PURGE "http://IP/object"
curl -X PURGE "http://127.0.0.1:80/ads.txt"
2
⚠️ Or you can completely vanish the cache by restarting the processes.
systemctl restart varnish
## Icecast Stream to icecast
ffmpeg -re -i ma_video.mp4 \
  -f webm -cluster_size_limit 5M -content_type video/webm -ac 2 \
  -acodec libvorbis -b:a 128K \
  -vcodec libvpx -b:v 10M -crf 10 -g 10 -deadline realtime -threads 4 \
  icecast://user:password@example.com:8000/mountpoint
2
3
4
5